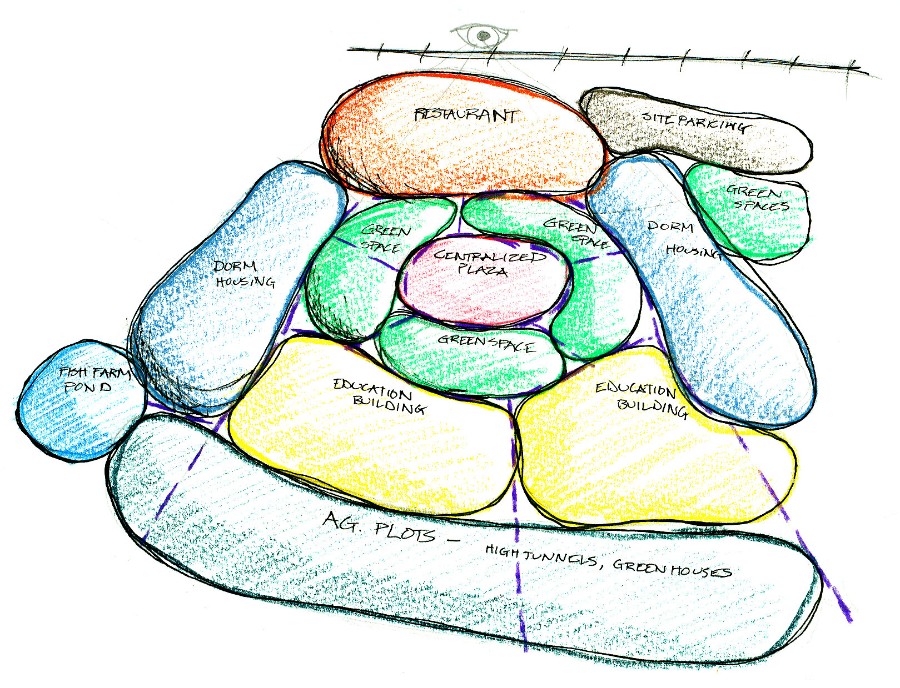
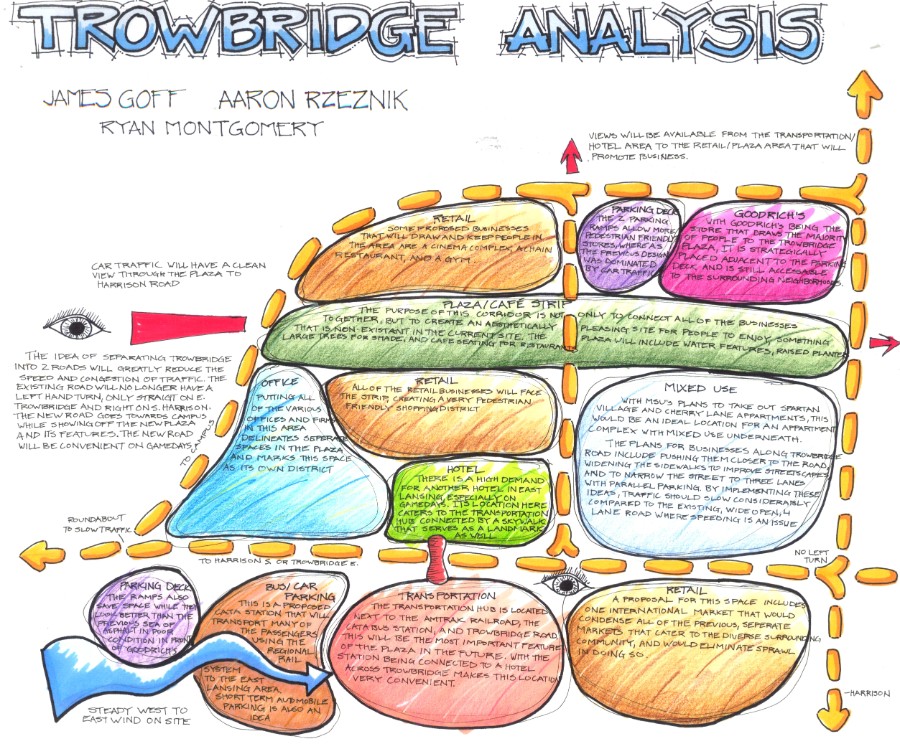
Inventory and analysis are used prior to any design phase of a project. Inventory takes into account what is currently present on site and analysis is then used to determine what exactly the inventory attributes mean to the site as far as their value to the new design of the site. After inventory and analysis are conducted, functional use diagrams are created and can serve as the initial design stages of a project. It's at this stage where spatial relationships are starting to form among different elements (existing and proposed) on site.
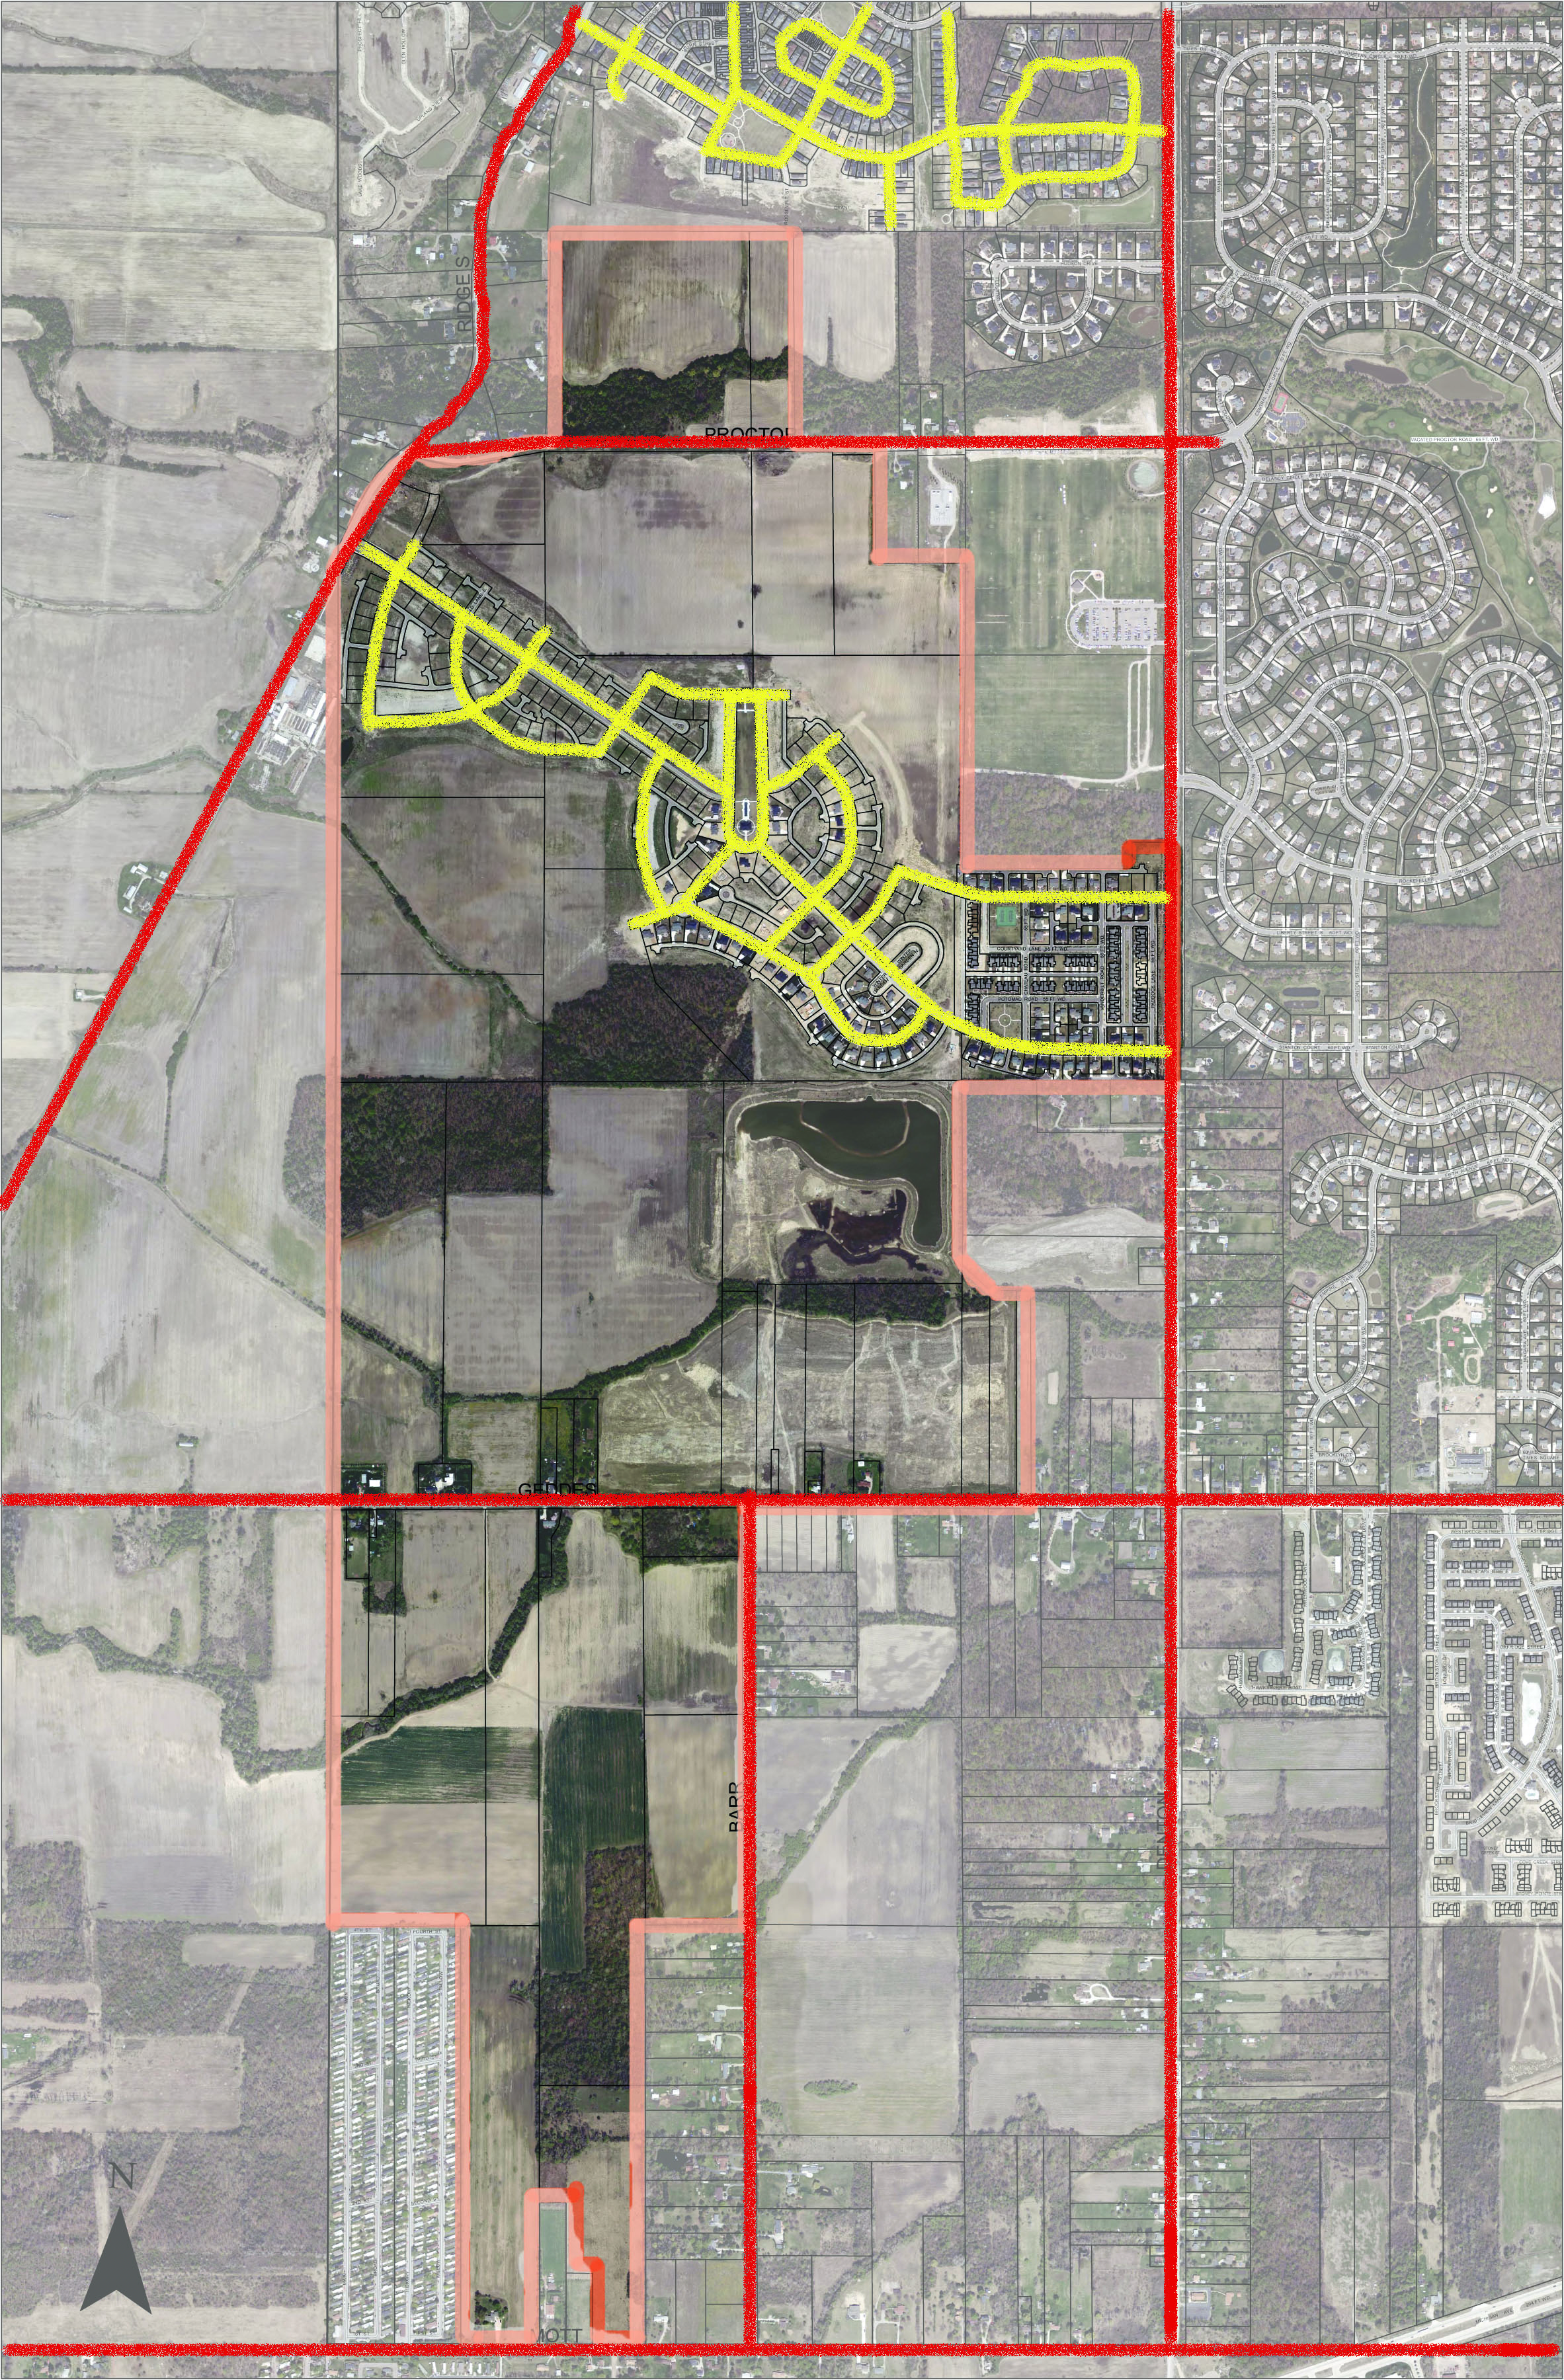
The inventory map above was created to identify different roads around an 800 acre site in Canton, MI for a vehicle circulation map. This was done to identify existing major roads, what directions traffic is coming from, and how to incorporate existing infrastructure into our design. The red lines represent major roads, pink lines outline the site border, and the yellow lines represent residential roads in subdivisions.
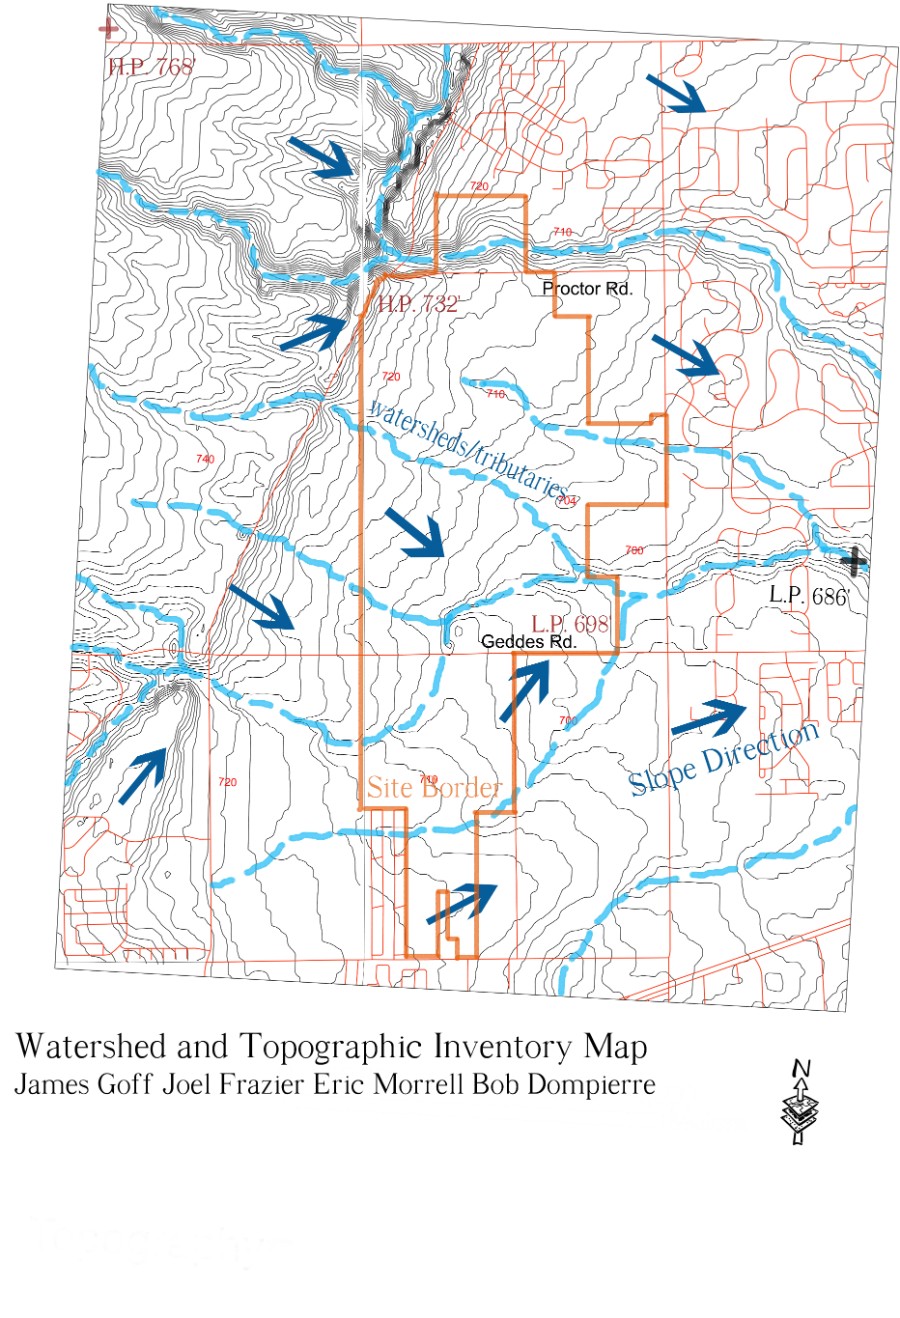
I created this topographic map on Adobe Photoshop for the same Canton, MI master plan project. I overlayed this map on our site border for multiple reasons: to identify % slopes on the land, identify the high point and low point of swale to better understand what kind of grading would have to take place in the site, and lastly to identify the direction of waterflow and major watersheds on site to try and incorporate this natural resource as an asset to our design.
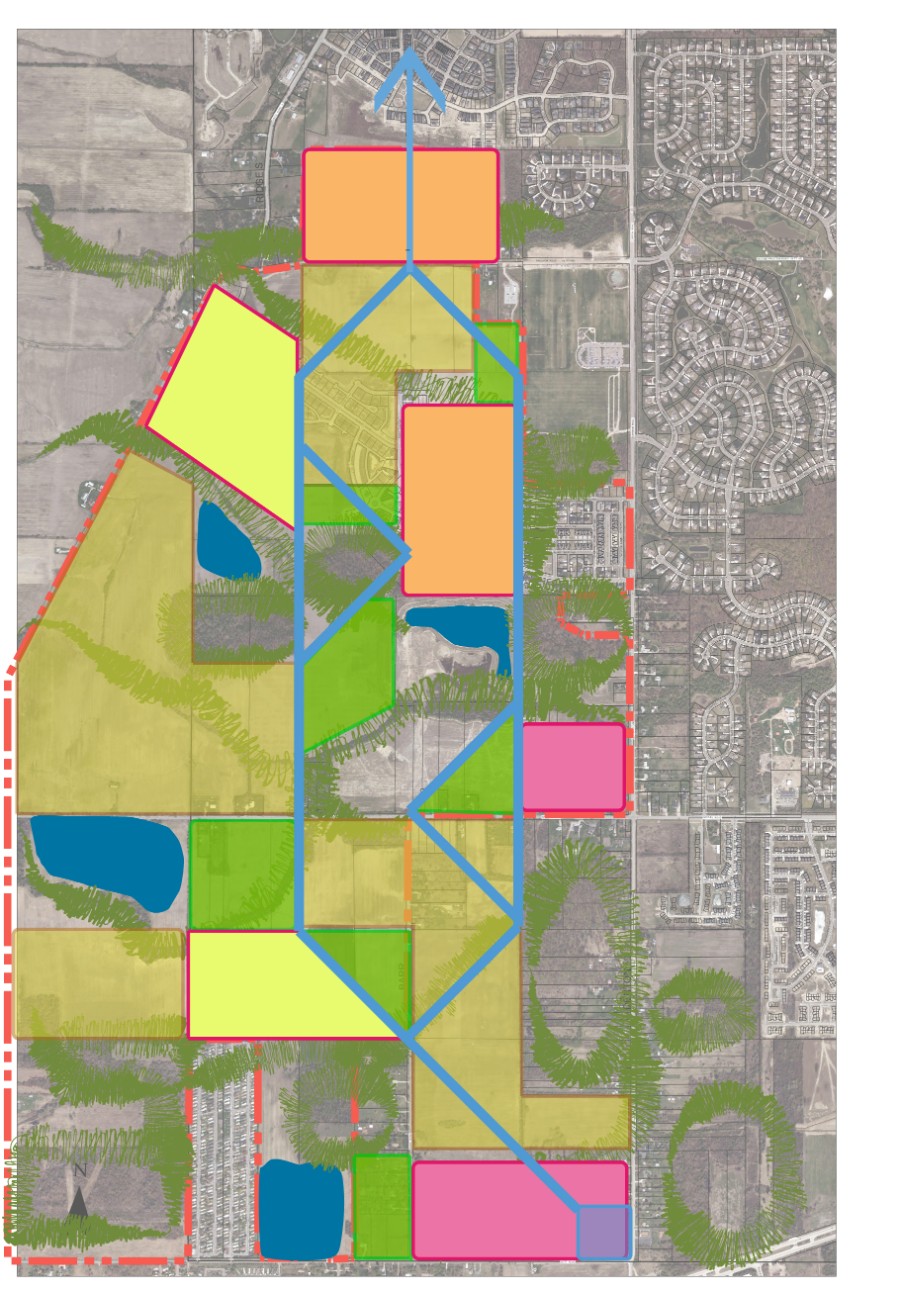
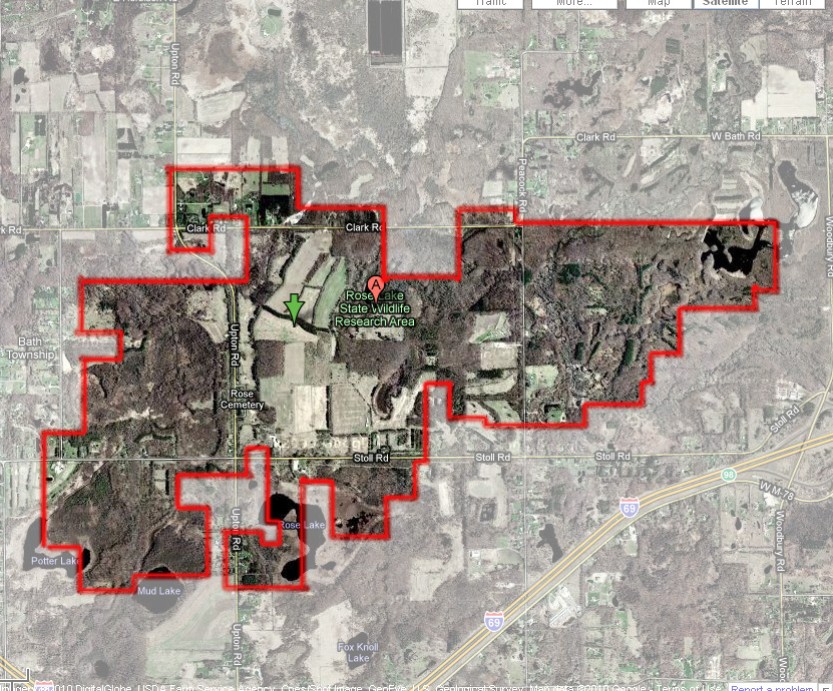
Using different opacities in photoshop can emphasize the importance of areas when looking at a plan view. Rose Lake Wildlife Research area in Bath, MI is highlighted here for a Fisheries and Wildlife coarse where a partner and I conducted a 40-year habitat analysis management plan for ruffed grouse and eastern cottontail rabbit.